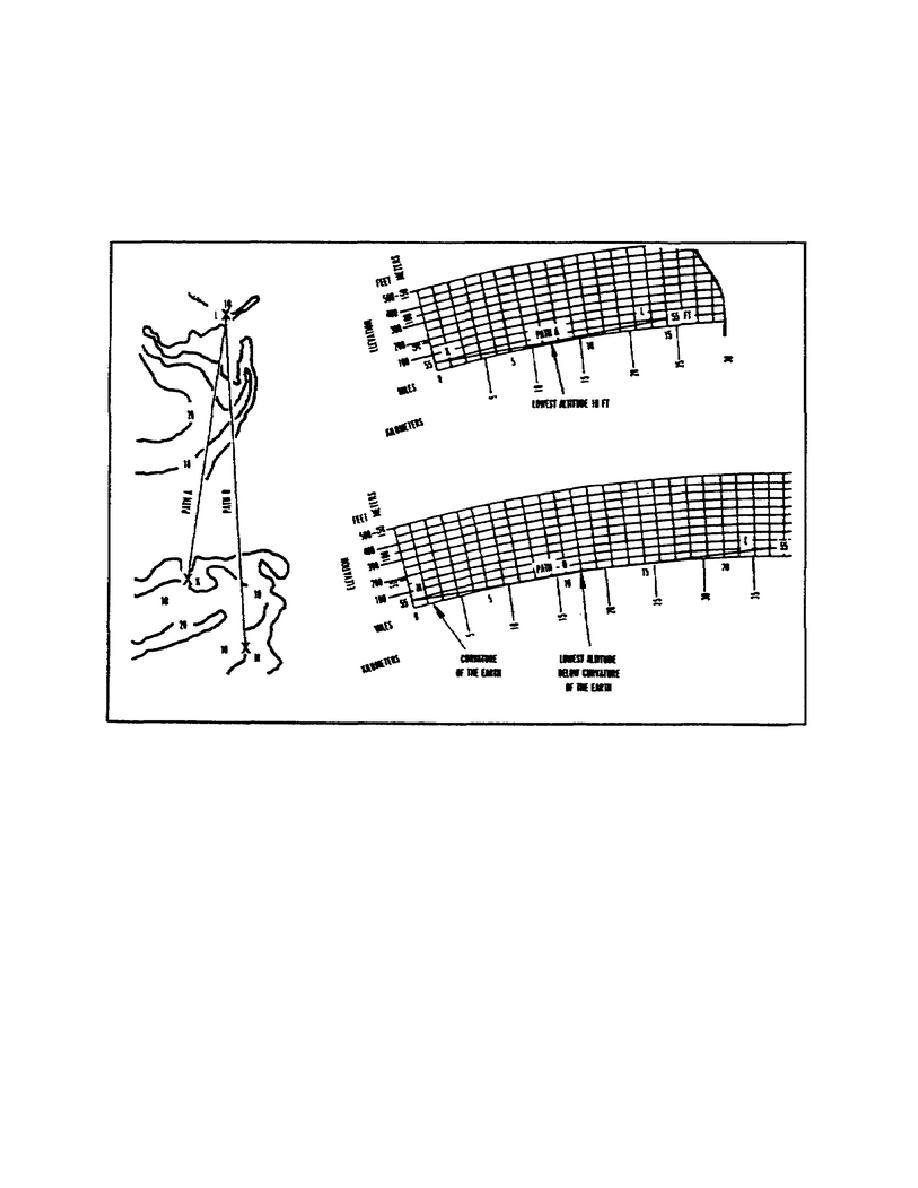
(b) Draw a line on the contour map between the two proposed
sites as in figure 2-7. Measure the length of this line and convert
it to the distance between the two points.
(c) Determine the elevation at each site from the
Figure 2-7.
Plotting profiles - lower altitudes
NOTE: Add the elevation of the antenna mast to the elevation for the
site.
For example, for path D in figure 2-8, station N is
1,350 feet.
Adding the antenna height (50 feet) brings the
total elevation to 1,400 feet.
Mark this point on the vertical scale of the graph above the
0-kilometer/mile point.
Station O has an elevation of 1,400 feet.
Adding the height of the antenna, we have an elevation of 1,450 feet.
Mark this point on the vertical scale above the 43-kilometer/27-mile
point (the distance between sites N and 0).
2-13
SS0016


 Previous Page
