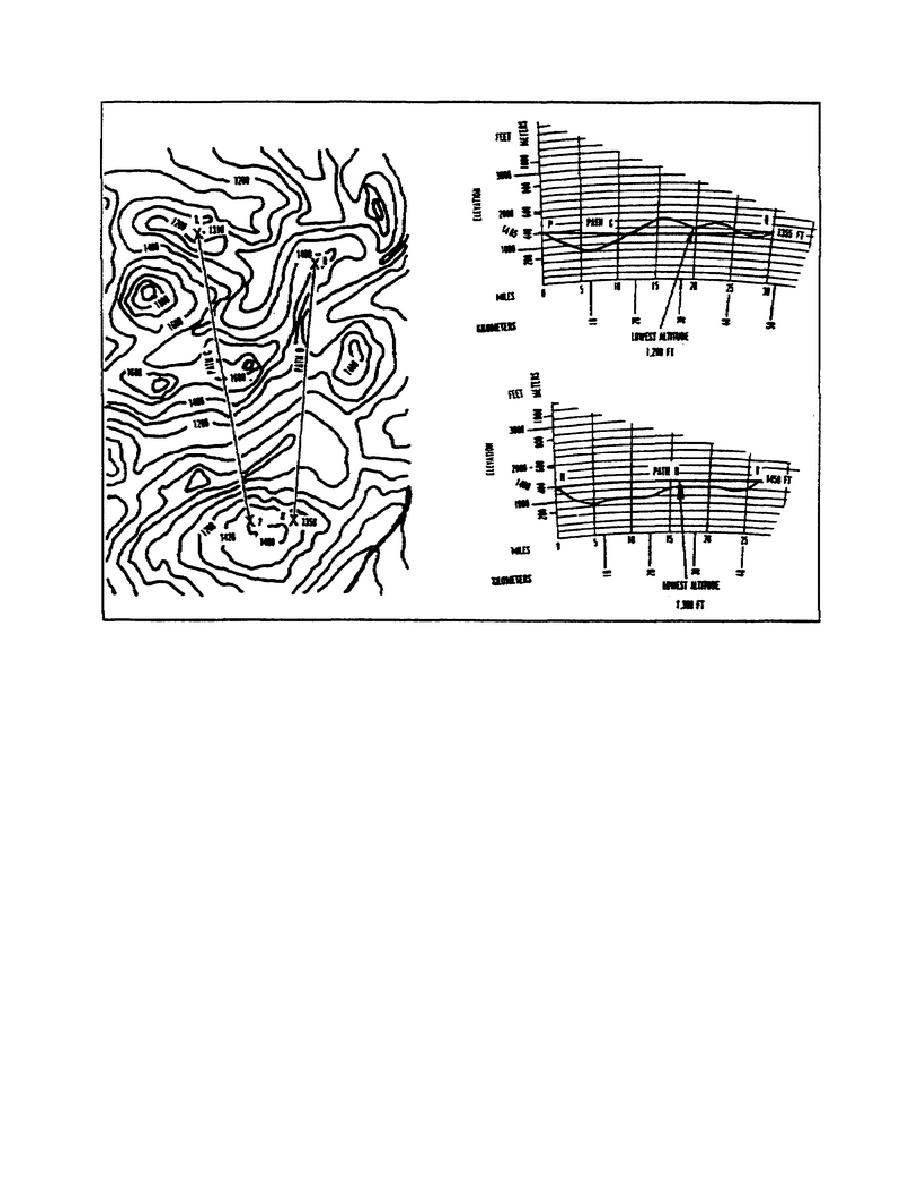
Figure 2-8.
Plotting profiles - higher altitudes
(d) Draw a straight line between these two points on the
profile chart.
Check the line and note its lowest point.
Draw a
complete profile of the terrain between the sites on the graph paper.
Any point above the straight line represents an intervening
obstruction in the path.
If you intend to include relay stations in your system, you must
consider the signal path of each hop. An LOS must exist between each
radio linked point.
(2) If you do not have nonlinear graph paper available, you can
plot the profile on linear graph paper, and then correct for the
refraction caused by the curvature of the Earth.
Use the chart in
figure 2-9 to correct for the Earth's refraction.
Plot your site
profile on linear graph paper as follows:
2-14
SS0016


 Previous Page
